Saturday, December 22, 2012

Applying Investing Lessons from Three Great Books

After re-reading The Great Gatsby and finishing Franklin and Winston earlier this fall, I jumped into another round of investing books. The three investing books I happened to read in recent weeks have also been some of my favorites.

Today I'd like to highlight one great lesson from each of these books and show how we can immediately apply them to our research processes.

What's Behind the Numbers?: A Guide to Exposing Financial Chicanery and Avoiding Huge in Your Portfolio (Amazon) by John Del Vecchio and +Tom Jacobs 


John and Tom are former colleagues of mine from +The Motley Fool, and being familiar with the quality of their work, I went in with very high expectations and still came away extremely impressed. Their book provides a thorough overview of some important yet often overlooked topics including earnings quality analysis, short-selling, deep value investing, long/short portfolio construction, and technical analysis.

The book provides dozens of great formulas and tips, but John and Tom emphasize the importance of one particular metric:
"Here are some of the factors that we analyze to determine the quality of the company's revenue. At the top is a metric you should have burned into your memory: days sales outstanding."
DSO = 91.25 x (Accounts Receivable / Quarterly Revenue)
This formula measures the number of days it takes the company to collect revenue after it makes a sale. If that figure is trending higher, for instance, it could be a sign that the company is offering more liberal payment terms to its customers in hopes of booking more sales now. A higher DSO alone doesn't necessarily mean something serious is afoot, but it can be a tip-off to look more closely at earnings quality.

To use a real-world example, let's take a look at the quarterly revenue and receivables of Sun Hydraulics* (SNHY)
Source: Company Filings, in thousands of $ except DSO
As we can see, SNHY's DSO has been pretty steady between 32 and 39 days over the past ten quarters, and there hasn't been any substantial increase in any year-over-year figure. If DSO had been trending upward -- to say, 45 or 50 days -- it could be a sign that management had been "stuffing the channel" to make short-term results look better and could come at the expense of longer-term results.

The Success Equation: Untangling Skill and Luck in Business, Sports, and Investing (Amazon) by Michael Mauboussin

While this book is not completely about investing, Mauboussin is the Chief Investment Strategist at Legg Mason and an adjunct professor of finance at Columbia, so there is naturally quite a bit of investing discussed along with some great discussion about the roles that skill and luck play in our favorite sports and games.

Perhaps unsurprisingly to us as investors, Mauboussin argues that luck plays a more significant role than skill in investing -- particularly in the short-run. As such, Mauboussin emphasizes the importance of a good process over short term results:

"Luck may or may not smile on us, but if we stick to a good process for making decisions, then we can learn to accept the outcomes of our decisions with equanimity."

One way we might improve our investing process is to create checklists and review them before making buy and sell decisions, particularly in stressful situations like the one illustrated in this example from the book:

"A friend at a prominent hedge fund told me that his firm has developed a checklist for responding when a company suddenly announces bad news. While the stocks of those companies always go down at first, sometimes the drop is nothing more than an opportunity to buy more shares. At other times, it's best to sell the position. The checklist helps the employees keep their heads cool as they decide which is the better decision."


Reading this particular paragraph inspired me to write the post What to Do When a Sell-Off Strikes Your Stock. To review, my "bad news" checklist is:
  1. It's important to stay as calm as possible. Breathe and scan. 
  2. Rather than read or watch news reports, which are typically sensationalized, go straight to the source. Read the company's press release and any associated presentation materials.
  3. After you've gathered the facts, develop your own take on the event.
  4. Revisit your original investment thesis, paying close attention to how the new information might impact the company's longer-term competitive position.
  5. Ask yourself, "Does this development fundamentally alter my thesis?" If so, consider selling and don't anchor into the price you originally paid for the stock.
  6. Consider buying more if your thesis remains intact, bearing in mind your current exposure to the investment and how the new share price compares with your fair value estimate. 
  7. Remember that doing nothing is doing something. As such, know why you're deciding not to take an action. 

Consider putting your own buy or sell checklist together. I think you'll find it to be a helpful exercise. 


Deals from Hell: M&A Lessons that Rise Above the Ashes (Amazon) by Robert F Bruner


Many individual investors have mixed feelings about M&A, particularly if its your company doing the acquiring. Misguided M&A decisions can destroy value, muddle financial statements, and can alter your original investment thesis. In short, they can be a real pain in the neck.

Bruner, who is the Dean of the Darden School of Business at the University of Virginia, makes the point early on, however, that:

"M&A failures amount to a small percentage of the total volume of M&A activity. Investments through acquisition appear to pay about as well as other forms of corporate investment. The mass of research suggests that on average, buyers earn a reasonable return relative to their risks."

Fair enough, but investors should still approach significant M&A deals with skepticism until proven otherwise. And, to Bruner's credit, this book does equip you with a good framework for evaluating M&A deals, featuring case studies of some of the worst deals in modern financial history -- i.e. Enron/Dynegy, Quaker Oats/Snapple, AOL/Time Warner, etc.

Bruner's list of common red flags includes:
  1. The business and/or the deal was complicated -- An acquired company that is difficult to understand or has a complex business model will likely be a difficult one to integrate.
  2. Flexibility was at a minimum -- A company that overpays for a deal and/or over-leverages its balance sheet to make the deal happen has little room for error. 
  3. The deal elevated risk exposure of the new firm -- The additional risk could come from a number of sources (legal issues, lower credit ratings, too much leverage, declining end-markets, etc.). 
  4. Decision-making process was biased -- An example here would be an overconfident management team that was willing to pay anything to make the deal happen. 
  5. Business was not as usual -- The deal creates a significant departure from the company's routine and/or expertise. 
  6. Cultural differences -- If two companies with very different cultures (i.e. regional customs, level of bureaucracy, etc.) merge, it could lead to the departure of key individuals at the acquired company.
As Bruner notes in the book, the "deals from hell" tend to occur when all six red flags are present.

To help us identify a poor M&A decision, Bruner provides this helpful summary of good and bad M&A traits:

Return to buyers likely higher if…
Return to buyers likely lower if…
Strategic motivation
Opportunistic motivation
Value acquiring
Momentum growth/glamour acquiring
Focused/related acquiring
Lack of focus/unrelated diversification
Credible synergies
Incredible synergies
To use excess cash profitably
Just to use excess cash
Negotiated purchases of private firms
Auctions of public firms
Cross borders for special advantage
Cross boarders naively
Go hostile
Negotiate with resistant target
Buy during cold M&A markets
Buy during hot M&A markets
Pay with cash
Pay with stock
High tax benefits to buyer
Low tax benefits to buyer
Finance with debt judiciously
Over-lever
Stage the payments (earnouts)
Pay fully up-front
Merger of equals
Not a merger of equals
Managers have significant stake
Managers have low or no stake
Shareholder-oriented management
Entrenched management
Active investors
Passive investors

If your company has just announced a major acquisition, turn to this table and see how many boxes fit the left column versus the right column. The more check marks on the right hand column, the more you should be skeptical of the deal.

Merry Christmas and Happy New Year!

As always, thanks for reading.

Todd
@toddwenning on Twitter


*I own shares of SNHY

Sunday, December 16, 2012

3 Reasons Why Most Dividend ETFs Will Fail

Today, there are some 50 dividend ETFs in the U.S. market with approximately $50 billion under management between them. A few years ago, there were only a handful of them to choose from. Thanks to the growing investor demand for income, however, they have rapidly attracted assets and, naturally, new ones seem to spring up each month.

In five years' time, I expect most of them to have gone the way of the Dodo, or at least have altered their mandates, as investors will eventually either a) be underwhelmed by their performance and/or b) find lower-risk alternatives for generating income and consequently take their money elsewhere.

Here are three reasons why I think that will be the case.

#1) They're basically closet-S&P 500 trackers with higher expense ratios

Most of the highly-liquid, higher-yielding stocks (the Exxons, GEs, etc.) are already found in the S&P 500, yet you'll likely pay at least 0.3% for a dividend-themed ETF versus 0.1% or less for an S&P 500 tracker. 

As this one-year performance chart comparing SPY with five of the larger dividend ETFs by AUM illustrates, you haven't been getting what you paid for. In fact, SPY was the best-performing of the lot. 

Source: Google Finance, as of Dec. 15, 2012
#2) Serious dividend investors can replicate the strategy on their own at a lower cost

An individual investor with a firm understanding of stock selection and portfolio construction could put together a diversified basket of individual dividend-paying stocks on their own -- that also better matched his or her risk tolerance and objectives -- and do so at a lower cost in the longer-term assuming they don't actively trade. 

Experienced dividend investors already know they can build their own portfolios and aren't the ones pumping money into dividend-themed ETFs. As such, I suspect that most of the money that's been invested in dividend ETFs over the past eighteen months has come from financial advisors hoping to eek a little more income out of their clients' portfolios in a low-rate environment, and that once interest rates rise (or tax rates change), they'll gradually switch their clients back to fixed income products.

#3) Dividend ETFs will be slow to adjust to changes in the market environment

It seems that each new dividend ETF that hits the market claims to have some kind of edge over the others -- "quality", "dividend dogs", and so on -- and they've all done backtests to show how their strategy would have worked over the past x number of years. 

The thing to keep in mind is that the dividend environment has changed dramatically over the past ten years and will likely change even more in the next ten. Since 2003, for instance, U.S. dividend tax rates were dropped to historic lows, the financial crisis led to hundreds of dividend cuts, and buybacks eclipsed dividends as the primary way that companies return shareholder cash. 

Looking forward, U.S. dividend taxes will go up in 2013 and that will certainly have a meaningful effect on corporate dividend policies in the coming years. All this is to say that dividend ETFs that construct their portfolios based on strategies that worked in the past may find that their formulas do not work going forward. 

My rule of thumb here is, the more "boutique" the dividend theme or strategy in an ETF, the more likely it will struggle to adjust to changing market conditions.

Bottom line

This is not to say that all dividend ETFs are doomed or unworthy of investment, but to be careful about which ones you choose. A number of them will be survivors, and they'll likely be the ones with the lowest expense ratios and broadest diversification. Sadly, those are also usually the ones that most-closely track the S&P 500 and offer the lowest yields. 

If you really want to give one of these new specialized dividend-themed ETFs a try, do proceed with caution. Don't focus on backtested performance, but focus on the fund's stock selection process. 

See you in 2013!

This will likely be my last post in 2012, so I wanted to say "thank you" for reading this year and to wish you a great holiday season. 

I also recently started up a dividend investing community on Google Plus, which you can join by clicking here (free with a Google account). It would be great to see you there!

Best,

Todd
@toddwenning on Twitter


Saturday, December 8, 2012

What to Do When a Sell-Off Strikes Your Stock

We've all been there. You check your stocks in the morning, take a sip of coffee, only to find -- spppittt! -- one of your stocks is down big, real big.

At this point many questions begin to race through your mind -- What happened? Did I miss something? Should I sell? Should I buy? It feels like the clock is ticking and that you need to make a decision now.

These are the times that try patient investors' souls*, and they're important ones to manage properly. Knee-jerk reactions are rarely rewarded in the stock market.

So let's explore ways that we might become better at handling these situations. Here are seven steps that I've come up with over the years:

  1. It's important to stay as calm as possible. Breathe and scan. 
  2. Rather than read or watch news reports, which are typically sensationalized, go straight to the source. Read the company's press release and any associated presentation materials.
  3. After you've gathered the facts, develop your own take on the event.
  4. Revisit your original investment thesis, paying close attention to how the new information might impact the company's longer-term competitive position.
  5. Ask yourself, "Does this development fundamentally alter my thesis?" If so, consider selling and don't anchor into the price you originally paid for the stock.
  6. Consider buying more if your thesis remains intact, bearing in mind your current exposure to the investment and how the new share price compares with your fair value estimate. 
  7. Remember that doing nothing is doing something. As such, know why you're deciding not to take an action. 
What do you think? Have one to add to the list? Please post your thoughts in the comments section below.

Best,

Todd 
@toddwenning on Twitter


*Hat-tip to Mr. Paine

Sunday, November 11, 2012

Why Tax Increases Could Lead to More Buybacks

(Note: Since this article was published, dividend tax rates were increased as expected, but in-line with long-term capital gains. This is a more positive outcome than the one described in the article where dividends and capital gains were taxed at different rates.)

It now seems certain that dividend tax increases are on the way starting in 2013.

The point of this post is not to argue the wisdom (or lack thereof) of a dividend tax increase from a fiscal standpoint, so I won't add to that discussion here.

Instead, I want to explore how tax rate changes could affect corporate distribution policies, especially if dividend tax rates end up being higher than long-term capital gains tax rates.

Even things up

Recall that in 2003, tax rates on qualified dividends were lowered to 15% and, more importantly, were brought in-line with long-term capital gains tax rates for the first time in many years.

Source: LMCM.com

The initial effect of the equalized tax rates, according to a paper by the National Bureau of Economic Research, was that "firms adjusted their distribution policy (specifically, dividends versus share repurchases) in a manner consistent with the altered tax incentives for individual investors."

Indeed, it stands to reason that another tax change in 2013 would similarly impact buyback and dividend policies.

Buybacks still surged

Despite the reforms that reduced the tax disadvantage of dividends, buyback activity has actually surged since the end of 2003 and has trumped dividend payouts 1.68-to-1 through 2011.

Source: Birinyi Associates and FRB Z.1.
We've previously discussed the reasons why buybacks can be more attractive to management teams, but investor preference for lower tax rates on capital gains cannot account for the boom in buyback activity since 2004 as tax rates have been equal over that time period.

That might change starting next year if no legislative effort is made to keep dividend and long-term capital gains taxes the same, as it would re-establish the tax disadvantage of dividends.

Source: Goldman Sachs
A tailwind for buybacks

Don't get me wrong -- I do not think that companies will stop paying dividends or stop increasing their payouts in a higher and unequal tax rate environment. Far from it.

It's entirely possible in such an environment, however, that relatively lower taxes on capital gains could add more fuel to buyback activity. If that's the case, dividend growth rates may be lower than what they might have been in an equal tax environment.

It's also possible that some younger companies that might have considered paying a small dividend in an equal tax environment may opt to focus on buybacks instead.

It will be interesting to see how it plays out, but unless Congress keeps tax rates on dividends and long-term capital gains the same (even if they are both increased) I expect to see buybacks continue to account for the bulk of total distributions.

Source: Birinyi Associates and FRB Z.1.
What do you think? Please share your thoughts below.

Thanks for reading!

Best,

Todd
@toddwenning on Twitter

Saturday, November 3, 2012

Using the Dividend Compass to Identify Troubling Trends

First off, thank you to everyone who has already taken a look at the Dividend Compass spreadsheet (which you can view and download for free by clicking here).

If you haven't the faintest idea what I'm talking about -- a forgiveable oversight :) --  here's an earlier blog post that explains the Dividend Compass and how it works.

Also, a special thank you to those of you who have provided valuable feedback on the Dividend Compass -- in particular to Pablo, who noticed a broken formula that has since been fixed.

Since we're nearly finished with 2012 (hard to believe!), I've added a column for trailing-twelve month (TTM) figures so the data is as fresh as possible.

Roll up our sleeves

Today, I'd like to illustrate a few ways in which you can use the Dividend Compass to notice trends in dividend health and growth potential.

The default company in the Dividend Compass is Johnson & Johnson* (a stock I own), which also happens to be a great example for trend-spotting.

Here's how the Dividend Compass results tab looks today:


Setting aside the weights and final score aside for a moment and focusing on the line items, we can quickly recognize a few trends.

On the positive side, operating margins remain solid, the balance sheet (based on interest coverage and net debt/EBITDA) remains in excellent shape, and the dividend looks sustainable on a free cash flow cover basis.

Unfortunately, the negative trends appear to outweigh the positives. Sales growth, dividend growth, earnings cover, and return on equity have all declined by at least two full Dividend Compass points since 2008.

Devil in the details

A glance at the results that feed into the Dividend Compass confirms these trends:


Recognizing these trends helps us focus our research. The negatives may or may not be as bad as they seem, but we do need to dig a little deeper to determine if the trends are genuine concerns.

On the slowing sales growth issue, JNJ has been adversely impacted by a few drug patent expirations, but relative to other major drug producers facing patent cliffs, JNJ's top-line isn't all that bad. JNJ's top-line has also been supported by consumer healthcare and medical device businesses. Still, the slowing growth is an issue to consider.

The declining earnings cover and ROE issues are linked as both metrics have been driven lower by the substantial litigation, product recall, and write-down expenses the company has taken over the past two years.

Excluding "one-time" charges like these, management expects 2012 adjusted EPS to be $5.05-$5.10 per share, which would equate to dividend cover near 2.1 times and implies an adjusted ROE of approximately 22-23%. In this light, things don't look quite as bad as the Dividend Compass score might suggest as the data is based on reported results and not adjusted results.

There's reason to believe that these expenses won't be recurring items, but the substantial charges have nevertheless impacted results as evidenced by slowing dividend growth and JNJ's relative under-performance over the period -- since the end of 2008, JNJ's share price has trailed the S&P 500 by 34 percentage points (SPY: +69.5%; JNJ: +35%).

However you view them, these one-time expenses matter and should be fully considered.

Bottom line

Whether or not you think there's cause for concern in this particular case, the Dividend Compass has helped us identify trends that required our attention. In some cases, we may find there's not a good explanation for the trends we see and that could be a sign to stay away or sell an existing position.

Hope you're having a great weekend and thanks for reading!

Best,

Todd
@toddwenning on Twitter

*This is not meant to be a full analysis of Johnson & Johnson nor is it an endorsement of the stock, but is meant to illustrate how the Dividend Compass can be used in your regular research. Further research is always necessary.


Sunday, October 28, 2012

5 Questions to Ask Yourself Before Buying a Stock

1. What do I know about this stock that other investors don't? 

Every investor who has ever bought a stock believes it to be undervalued or under-appreciated by the market, but before you press the "buy" button it's absolutely critical to think about your competition and what it might know and not know. If the market agrees with your thesis, for instance, there isn't much room for outsized growth.

After all, there are myriad analysts and investors who know a given industry inside-and-out and at least a few of them probably have better access to information, management, suppliers, and customers than you do. So, what might they be missing?

If you're looking at a large-cap stock, perhaps it's that the market is thinking too short-term or is under-appreciating the company's longer-term advantages. If you're looking at a small-cap stock, maybe it's that institutional investors have yet to pick up on the opportunity. Whatever the answer might be, be sure that you have an answer to this question before buying the stock.

2. Does this company have a sustainable competitive advantage? 

A company doesn't necessarily need a sustainable competitive advantage to make it a good investment, but if you're assuming robust growth, generous profit margins, and high returns on equity in your forecast then it's imperative to be able to identify the source of the company's competitive advantage.

If you can't determine a source, then the company probably doesn't have a competitive advantage and it may be necessary to revisit your assumptions.

If you can determine the source of sustainable competitive advantage, the next question to ask is "How long do I expect this advantage to remain intact?" Eventually, competitive forces will begin to chip away at the company's defenses and very few companies can keep competitors at bay for more than five years. Be fair, but be realistic with your assumptions.

3. If the stock loses 50% of its value over the next three years, what happened? 

Some investors call this the "pre-mortem" test. The idea is to identify potential thesis-destroyers before they materialize and hopefully help you sidestep a permanent loss of capital.

Once we've become bullish (or bearish) on a stock, it's natural to place a higher value on information that affirms our thesis and overlook or dismiss important risk factors. By forcing ourselves to consider what could go wrong, we can break that dangerous positive-feedback loop and better understand the risks before investing.

4. In two minutes, can I explain to a friend how this company makes its money?

Some companies have very straightforward business models while others can be extremely complicated with half-a-dozen reporting segments, joint-ventures, or merger activity.

If you can't make a succinct elevator pitch to a friend, describing how the business works -- that is, how money flows from customers to the company and then how the company uses, reinvests, and distributes that cash to shareholders -- it's probably not a stock you should own.

5. When will I sell this stock?

Even if you're a dyed-in-the-wool buy-and-hold investor, there are still circumstances where it might behoove you to consider selling the position. For example, the stock could greatly exceed your fair value estimate, a better opportunity could present itself, or your original thesis could be broken.

The important thing is to have some type of exit strategy established so that if and when that situation presents itself, you'll be less likely to second-guess your decision.

Share your questions

What questions do you ask yourself before buying a stock? If you'd like to share, please add them in the comments below.

Thanks for reading! Hope you had a nice weekend.

Best,

Todd
@toddwenning on Twitter

Sunday, October 21, 2012

An Important Misunderstanding About Dividends

My interest in dividends began during a previous job in which I helped manage the portfolios of ultra-high net worth individuals.

In many cases, the account owners had bought their stocks decades earlier, never touched them, reinvested their dividends, and were now living off the dividends from those investments without needing to touch the principal. The principal was then typically passed onto children and grand-children who were always, of course, appreciative of grandpa's or grandma's wise investment decisions.

This approach to investing was radically different from what I had previously understood investing to be -- that is, trading and taking bets on the next "big" thing. Patient dividend investing seemed a much more reasonable (and rational) approach for an individual investor and the bulk of my own investments today remain aligned with this valuable strategy.

As I learned more about dividend investing, I came across a number of academic studies and books that suggested that the vast majority of long-term returns from stocks were attributable to dividends. Indeed, these studies fit nicely with my experiences working with the wealthy investors who harnessed the power of dividends to build their family fortunes.

Looking more closely at these studies, however, I found that they assumed 100% dividend reinvestment, which overstates the contribution of dividends to long-term returns.

Earth to the ivory tower...

The 100% reinvestment assumption is simply not practical. Taxes, for one, can prevent full reinvestment as can commissions, the inability to reinvest in fractional shares, and an investor's decision to spend or save the dividend rather than reinvest it.

A 2011 paper by Legg Mason's Michael Mauboussin sheds much light on this topic and correctly emphasizes the distinction between the equity rate of return (price appreciation plus dividend yield) and the capital accumulation rate (returns including reinvested dividends).

Mauboussin provides two helpful formulas to help us understand the math behind total shareholder return (TSR).

1.) TSR = g + (1+g)*d

Where:
           g = the annual price appreciation rate
           d = dividend yield

This TSR formula assumes 100% reinvestment of dividends and is likely the one used in the previously referenced academic studies. To illustrate, a stock that's growing at 7% per year and has a 4% starting dividend yield should generate TSR of 11.28% annualized (0.07 + (1 + 0.07)*0.04).

TSR equals the capital accumulation rate (CAR) only when there's 100% reinvestment. The following formula shows the CAR when there isn't 100% dividend reinvestment. It's the same formula as the first, with a slight modifier that incorporates rate of reinvestment.

2.) CAR = g + (1+g)*d*r

Where:
           r = % reinvested

To show how various rates of reinvestment can dramatically affect long-term returns, the following chart and table assume a $1,000 investment in a stock with a starting dividend yield (d) of 4% and annual price appreciation rate (g) of 7% at various rates of reinvestment over time.


As you can see, anything less than full reinvestment results in a lower CAR, and price appreciation rather than dividends accounts for a larger and larger percentage of the results. If the investor chooses to reinvest nothing and instead chooses to consume the dividend, the only source of growth is price appreciation.

To further illustrate the importance of price appreciation in returns, let's assume an annual price appreciation rate (g) of 0% at various rates of reinvestment.


Over 30 years assuming 100% reinvestment, a $1,000 investment in a stock with an initial dividend yield of 4% and price appreciation of 7% will be worth $24,690; if price appreciation is 0% it will be worth $3,243. When there's no price growth, you're just purchasing additional shares.

In other words, while we can clearly see the importance of reinvesting dividends in enhancing the benefits of compounding growth, we can also see that price appreciation matters more than the oft-cited studies suggest.

This isn't a dividend downer 

By no means should this be taken as a knock on the power of dividends. Rather, it shows that investors also need to pay attention to price appreciation and valuation. Dividends alone don't drive returns. 

While the academic studies over-emphasize and perhaps misrepresent the contribution of dividends to long-term shareholder returns, the studies remain an important part of the discourse about dividends and illustrate quite clearly how dividends enhance the benefits of compounding growth. Their lessons should still be heeded.

The more fully you can reinvest each dividend received, the higher your potential longer-term returns. A few ways that you can maximize your reinvestment rate are to hold your dividend paying stocks in tax-advantaged accounts like IRAs (US) and ISAs (UK), to compare your broker's reinvestment fees (if any) and policies (do they allow fractional reinvestment?) versus others, and to evaluate your reinvestment strategy.

Thanks for reading! Please post any questions or comments below.

Best,

Todd
@toddwenning on Twitter

Note: In the original post, I mislabeled CAR in the second formula and in the examples. It has now been updated. Apologies for the confusion. 

Saturday, October 13, 2012

Should We Do Away With Dividend Yield?

We may not like it, but buybacks are here to stay. Management teams prefer buybacks for a number of reasons, even though those reasons may not always be in the best interests of their shareholders.

So ingrained are buybacks in today's market that some have called for an end to the classic definition of dividend yield (dividends per share / share price) to be replaced with a "modified" or "total" yield that includes buybacks ( (dividends + buybacks per share) / share price). 

Indeed, Standard & Poors now includes a "dividend & buyback yield" column in its quarterly update on S&P 500 distributions. Ready or not, it's becoming a more commonly-used metric.

The game has changed...

The total yield approach is somewhat instructive as it helps explain a number of things that we've seen in the 30 years since Congress (via rule 10b-18) allowed companies to make greater use of buybacks. 

The major thing total yield helps explain is why dividend yields over the past 30 years remain well-off historical averages. The chart below shows the dividend yield of the S&P 500 between 1960 and 2011 and compares it with the total yield of all U.S. companies since 1985 when buybacks started becoming a meaningful way of returning shareholder cash. 

Source: S&P (via Aswath Damodaran) and Birinyi Associates and FRB Z.1. (via Michael Mauboussin) 

Recognizing there's only a slight difference between the 1960-2011 and 1985-2011 data, the major difference between the red and blue lines is buyback yield. Put in this perspective, the decline in dividend yield can be rationalized as a paradigm shift toward alternative ways of returning shareholder cash.

In fact, it shows that companies have become even more generous with distributions than in the past. 

(Don't break out the party hats just yet...)

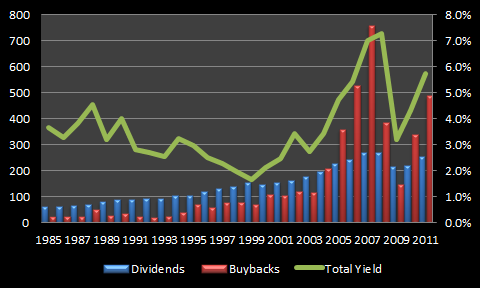
The next chart provides more granularity for the total yield period and shows the rise of buybacks as the primary means of returning shareholder cash between 1985 and 2011.


Source: Birinyi Associates and FRB Z.1.  
As you can see from these two charts, buybacks have only recently become a truly driving force in the total yield equation. Until 2004, dividends had accounted for the majority of distributions -- even during the dotcom boom.

Predictably, the buyback trend since 2004 has largely followed the market. When the market has been good and companies feel flush, buybacks have increased, and vice versa. Curiously -- and sadly -- as Michael Mauboussin points out here, M&A activity has generally followed this path, as well:

Indeed, M&A and buybacks follow the economic cycle: Activity increases when the stock market is up and decreases when the market is down. This is the exact opposite pattern you’d expect if management’s primary goal is to build value.  (His emphasis)
One shining example of this principle in action has been Hewlett-Packard, which repurchased $36 billion of its stock between 2008 and 2011.

Its current market cap is $28 billion.

Long-term HPQ shareholders certainly don't feel any richer despite the $36 billion buybacks that should have been used to enhance shareholder value -- or in part distributed to shareholders as special cash dividends. Worse, most of the buybacks were fueled by borrowings and HPQ's debt/equity ratio increased from 13% in 2007 to 76% in the most recent quarter.

...but common sense remains common sense

There are companies that make prudent use of buybacks and no, I'm not completely opposed to them; however, general market data shows that, on average, buybacks are value destructive.

For this reason alone, I cannot accept the idea that we should do away with dividend yield and replace it with a total yield metric that includes buybacks. The two types of returning shareholder cash are simply not apples-to-apples. 

The total yield metric is certainly instructive, but given the differences between dividends and buybacks and the track record of companies destroying value using buybacks, it's critical to keep dividend yield and buyback yield separate.

Hope you're having a great weekend! Thanks for reading.

Best,

Todd


Saturday, October 6, 2012

Where to Find Value in the Dividend Market Today

There's no question that dividend-paying stocks have become more popular in recent years as interest rates on fixed income and savings products declined.

Indeed, dividend-focused ETFs and mutual funds have experienced strong inflows, some higher-yielding stocks in rather staid industries (tobacco, utilities, etc.) are trading with multiples above their five-year averages, and gross S&P 500 dividend distributions will almost certainly hit a record high in 2012.

Contrarian investors will naturally raise an eyebrow or two at these developments.

Time to bail?

The heightened interest in dividends has led to some speculation that a "dividend bubble" might be afoot. As you might expect, massive debate has ensued among pundits, normally with the author taking a firm and uncompromising stance on one side or the other.

The problem isn't that either side hasn't made fair observations, but that the debate is all too frequently framed around whether or not there is in fact a "bubble" -- definitely the most overused term in financial media -- and misses the fruitful middle ground, leaving the reader without any actionable guidance ("Great, there is/isn't a dividend 'bubble'. What now?")

Instead, I find it far more instructive to critically examine the landscape as it stands today without being handcuffed to the bubble framework.

Is there "irrational exuberance" for dividend-paying stocks today? Relative to the exuberance we saw with dotcom stocks or housing, absolutely not. If there were, I don't think you'd see this trend in U.S. payout ratios.

Aswath Damodaran, Standard & Poors
It stands to reason that if investors really were falling over themselves to buy dividend stocks, companies would respond by paying out a greater percentage of earnings as dividends, so as to attract more investor interest. While some companies may have accelerated their dividend payouts for this reason, on average, that's not happening.

Instead, S&P 500 companies used buybacks over dividends to return cash to shareholders by nearly a 2:1 ratio in the second quarter. The trailing 12-month S&P 500 dividend payout ratio stands at just 32%.

Source: Standard & Poors

Might some institutional investors be using buybacks to 'create' their own dividends? Maybe, but you could have just as easily have made the case for that in 2007 when dividends certainly weren't in style.

And yes, aggregate dividends of $67.31 billion in Q2 2012 set a record -- finally eclipsing the previous record of $67.09 billion set in Q2 2007. Flat nominal dividend growth over the course of five years is hardly an indication that corporations are opening the spigots to satiate investor appetite for dividends.

Are some dividend-paying stocks overvalued today? Yes. Judging by the multiples on some low-growth, high-yielding stocks today, I think it's likely that income-thirsty investors have in some cases reached for yield and bid the share prices above their fair value.

Similarly, so-called "quality" dividend-paying stocks -- that is, stocks with long track records of raising payouts each year (Aristocrats, Achievers, etc.) and investment-grade balance sheets -- as a group seem to be fully valued.

Are all dividend-paying stocks overvalued today? No. I think there's likely more value to be found in the lower-yielding areas of the market, as investors who are solely interested in current income are focused on the higher-yielding stocks and may not have the time horizon or interest to wait for the dividend to grow over time.

Where might there be value left among dividend-paying stocks? Investors who have just started building a dividend-focused portfolio are not likely to find many deep value opportunities in the high-yield or traditional "quality" space right now.

The most fertile ground for moderate- to high-yielding stocks today is likely found in stocks that have just recently started paying dividends (as they're not yet included in Aristocrat/Achievers screens and trackers), stocks that may have cut their payouts during the financial crisis but are on the path to recovery, and in smaller-cap stocks where the large funds are less likely to hunt for yield.

Bottom line

While there isn't a dividend "bubble", I will say that most of the low-hanging fruit has been picked. As such, you'll need to do a little extra homework if you hope to land some undervalued dividend-paying stocks with relatively good yields right now. It's no longer as simple as picking 12-20 stocks that everyone knows with investment-grade balance sheets and decades-long dividend track records. Yet there are still opportunities out there for investors willing to do the extra work.

(If you need a little help analyzing the stocks you come across, my free Dividend Compass tool can help you with your research.)

As always, stay disciplined and patient out there.

Best,

Todd Wenning
@toddwenning on Twitter

Saturday, September 15, 2012

Should More Companies Adopt Flexible Dividend Policies?

In the U.S. and U.K. markets, the most common form of dividend policy is one that aims to pay at least the same amount year after year, regardless of the company's performance that year. I'll call this the "consistent" dividend policy.

In such a system, a dividend increase is typically seen as a positive thing -- a sign that the company expects profitability to improve in coming years. Conversely, a dividend cut is usually a negative -- a sign that the company has run into trouble and needs to shore up cash.

Indeed, a number of companies have run into trouble desperately trying to maintain the historical dividend level -- borrowing, selling assets, etc. -- when the logical thing to do would have been to reduce the dividend payout until things got better.

An alternative approach is the "flexible" payout policy in which a company establishes that it will pay a certain percentage of earnings or free cash flow each year. The payout amount could fluctuate up and down, but it relieves the company of having to worry about maintaining a certain payout each year.

I see benefits and drawbacks to both approaches. In the end, I think it depends on the nature of the company's business and the precedent that it has set with shareholders.

U.K.-based Rotork, for example, operates in a cyclical industry and smartly implements a flexible dividend policy that incorporates a "core" dividend that grows in line with earnings plus an "additional" dividend in particularly good years. If the company runs into a bad year, the total payout may be lower than the previous year, but shareholders will likely be more accepting of that since the policy has been clearly communicated and consistent.

On the other hand, Procter & Gamble (a stock I own) operates in a more defensive industry and has paid an increasing dividend for 56 years. As such, its shareholders expect a consistent (and rising!) payout each year. A lower dividend would be disastrous signal.

All that said, many large companies with consistent dividend policies also practice flexible distribution policies -- it's just that they substitute buybacks for cash dividends to bridge the gap. In other words, they maintain a consistent dividend policy and adjust to the business climate using buybacks.

As the chart below shows, since 1999 the modified payout (dividends + buybacks) has fluctuated quite a bit, but the median modified payout has been about 82%.

Source: Standard & Poors
U.S. companies are paying out most of their earnings over the business cycle, just not with dividends -- the median dividend payout ratio over the period is 35% with the balance going to buybacks.

If anything, then, investors who prefer a flexible dividend policy should be demanding that companies use a greater percentage of actual dividends in their distribution policies (i.e. a normal + special dividend policy). I think there's a good case for that.

What's your take? Have a suggestion for future posts? Please post your comments below.

Have a great weekend.

Best,

Todd
@toddwenning on Twitter

Saturday, September 8, 2012

Are You a Better Investor Than Fund Managers?

Earlier this week, I came across an interesting study by Andriy Bodnaruk of the University of Notre Dame and Andrei Simonov of Michigan State University, entitled "Do Financial Experts Make Better Investment Decisions?"

The pair analyzed the personal portfolios of 84 Sweden-based fund managers and compared them those of  non-professional peers that had similar backgrounds as the fund managers.

Among their findings...
We find no evidence that financial experts are making better investment decisions than their less financially astute peers: they do not outperform, do not diversify their risks better, and do not exhibit lower behavioral biases...Our results demonstrate that day-to-day knowledge of financial markets does not improve investment decisions.
          ...
We find that financial experts do not exhibit superior security picking ability in their own portfolios. Private investments of fund managers perform on par with investments of investors similar to them in terms of age, gender, education level, income, and wealth. Even more striking, mutual funds managers’ investments perform worse than private investments of wealthiest 1% of investors. Moreover, non-MF-related investments of managers significantly underperform their MF-related investments. This suggests that a part of overall managerial performance should be credited to access to fund’s resources.
But not so fast -- the authors do insert important qualifiers as it pertains to the definition of fund managers' peers:
Our results can be best summarized in the following way: day-to-day knowledge of financial markets is of little value for investors with a high level of general intelligence – both managers and their peers are among the most educated and wealthy investors. It is plausible that marginal effect of financial expertise on investment decisions is trivial for these investors, but is of larger importance for less sophisticated individuals. Our results, nevertheless, provide important insights as they demonstrate that there are limits to the value added by financial expertise. 
In other words, financial literacy and a fair level of intelligence are still essential if you plan on investing on your own. You have to want to continuously learn about investing and keep up with your investments. Some people don't want to learn, and that's fine, but that group should probably outsource their investment management to professionals anyway.

Assuming that we have the requisite intelligence, knowledge, and motivation to manage our own investments, however, this study is indeed encouraging to individual investors.

If I've learned one thing in my investment career, it's this: superior investing results require superior decision-making skills. You can have access to all the information in the world, but at the end of the day the information isn't worth much if you're not using it to make better decisions. Great analysts don't necessarily make for great investors, and vice versa. Great analysts are great information gatherers and interpreters; great investors are great decision-makers.

After you've established a good foundation of investing knowledge, the next step is to understand investing psychology, behavioral finance, and risk. In fact, I've learned more about making smart investment decisions from these three books as I have in all the accounting and financial theory books I've read.


If you haven't read one or any of these, I can't recommend them enough. I find myself re-reading them again and again to let the lessons sink in.

The better you understand yourself -- what's behind your decision-making process, what triggers emotions, and the lessons learned from previous mistakes -- the better investor you'll be. I do believe that the non-financial professional with street smarts, self-awareness, and a solid financial foundation can achieve excellent long term returns.

Have a great weekend!

Best,

Todd
@toddwenning on Twitter

P.S. If you'd like to receive an email whenever a new blog is posted, please enter your email in the box at the top right-hand corner of the screen. 


Sunday, August 19, 2012

Introducing the Dividend Compass

When it comes to equity analysis, a lot of attention is paid to valuation -- and rightly so, as your investing career will likely be a short one if you consistently overpay for assets.

Surprisingly, however, there's typically little attention paid to dividend analysis, which usually begins and ends with a glance at the dividend payout ratio (or dividend cover). As long as the company is earning more than it's paying out, the thinking goes, all is well with the dividend; conversely, if the company is paying out about the same amount as (or more than) it's earning, the dividend is at risk.

There's more to it

While the payout ratio is important, in my experience, the main causes of a dividend cut are factors other than a high dividend payout ratio (or low dividend cover). Indeed, a high payout ratio is usually the result of past events and trends that have been in place for a number of years.

In fact, more times than not, the need to strengthen the balance sheet is the cited reason for a dividend cut -- creditors and ratings agencies get worried about a lack of cash flow and large dividends become an easy target for freeing up cash. In turn, a weak balance sheet is often the result of a deterioration in business strength over a number of years -- margins have contracted, growth has slowed, and free cash flow has dried up -- paired with over-borrowing or over-spending.

Early diagnosis is the key

So rather than just look at the dividend payout ratio, it seems prudent to take a more holistic approach to dividend analysis by considering other factors that contribute to dividend health, such as:
  • Sales growth: Sales are the life-blood of a company. If sales are drying up, that puts added pressure on profits and cash flows and thus the dividend, too.
  • Interest coverage (EBIT/interest expense): If a company is having trouble paying the interest on its debt, there's a greater chance that its creditors will get worried and raise the company's cost of borrowing, which could reduce net income. In a worst-case scenario, the dividend could be cut to accelerate the repayment of principal. 
  • Net debt/EBITDA: This is a common measure ((Debt-Cash)/EBITDA) that creditors and ratings agencies use to determine credit quality and it's commonly used as a metric in debt covenants. A firm that has borrowed too much or is struggling to pay down its debt relative to its profitability is more likely to have a risky dividend.
  • Dividend growth rate: A slowing dividend growth rate could be a sign that the company is less confident in its future growth potential. Eventually, all companies' dividend growth rates decline, but you want to see a steady decrease over many years and not a sharp drop.
  • Earnings cover: Even though I don't think it's the best measure of dividend health, earnings cover (Net Income/Dividends Paid) remains the most common metric cited by both companies and investors alike, so it should be considered in any dividend analysis.
  • Free cash flow cover: Free cash flow cover ((CFO-CapEx)/Dividends Paid) is a better measure of dividend health than earnings cover because companies don't pay out earnings -- they pay out cash. As such, I'd rather look at a company's cash flows than net income.
  • Operating margin: A company whose margins are contracting could be facing increased competitive pressures or becoming less efficient. When this occurs, less money falls to the bottom line and to cash flows and the dividend can become riskier. Cyclical companies' margins will naturally ebb and flow. In those cases, use rolling 5-year margins to account for the business cycle.
  • Return on equity: Companies that are unable to sustainably generate returns above their cost of equity are likely destroying shareholder value and usually have lower growth potential. Neither are good things from a dividend perspective.
Dividend Compass Tool 
 
With this framework in mind, I tried my hand at a new (and hopefully improved) spreadsheet model for rating the health of a company's dividend. I'm calling it the Dividend Compass, and you can access and download it for free by clicking here.

(It's hosted on Google Docs for sharing purposes, but you can download it to Excel by clicking on File>Download As>Excel on the top left hand corner of the Google Docs page. Once you've downloaded it, you can make changes. If something doesn't work, please let me know in the comments section below.)

To get started, all you need to do is enter a few years' worth of key financial datapoints (sales, debt, etc.) -- all publicly available data -- on the Inputs tab and then click on the Dividend Compass tab.


The Dividend Compass (DC) will rate the company's dividend health based on metrics derived from your entries, with a 5 being a perfect score and 1 being the lowest. The overall score is based on the weighted average scores of the eight metrics and the default weights are based on what I believe to be the most important metrics. You can change them to fit your approach as long as they sum to 100%.


The DC will also grade the dividend going back a few years and provide a 5-year average score that will help you identify trends in the dividend's health. A falling score in any of the categoreis, for instance, may indicate a trouble spot that's worth looking into.

A few things to remember

I can't stress enough that the DC should not be used as a buy/sell indicator nor is it meant to be the final word on any stock. It's simply a research tool to help you tell the difference between a healthy dividend from a risky one, using a more holistic approach than traditional methods. Further research is always necessary before making a trading decision. 

Dividend yield is not included as a graded metric in the DC. All else equal, I would expect higher yielding names to have lower scores and vice versa.

Finally, the DC is still in early days, so if you notice a bug or see room for improvement, please post a comment below. Questions and criticisms are always welcomed, too.

Hope you had a nice weekend.

Best,

Todd
@toddwenning on Twitter
(long JNJ, the default example in the DC spreadsheet)


Saturday, August 11, 2012

Do Banks Deserve a Place in a Dividend Portfolio?

Earlier this week, we learned that Standard Chartered bank (a stock that I own) was accused by the New York Department of Financial Services (DFS) of engaging in illegal financial transactions with Iran. A worst-case scenario for the bank would be a loss of its New York banking license -- a possibly crippling action since so much money flows through the state of NY, and specifically New York City. The best-case scenario (save a complete dismissal of the allegations) would be a one-time fine and a temporarily tarnished reputation.

Pick your poison

From a dividend investor's perspective, the first case would be far worse as it could impair long-term profitability (indeed, StanChart keeps its accounts in USD) and increase the risk of a dividend cut or perhaps a rights issue. Assuming StanChart did, in fact, do something illegal a hefty a one-time fine should be relatively good news for dividend investors as the company's payout ratio is about 40%, so there's some margin of safety there to absorb a one-time shock. Plus, StanChart has excellent liquidity metrics and an industry-leading capital position. It would have to be a very severe punishment, in my opinion, to put the dividend at risk.

Just a few weeks ago StanChart increased its dividend by 10%, so if the firm knew about the DFS investigation it clearly felt comfortable raising the payout. If management didn't know about the DFS investigation then it either thought it was doing legitimate business in Iran or it was delusional enough to think they would get away with it. If management knowingly conspired or concealed transactions while at the same time heralding its reputation to investors in the recent conference call, that would be enough for me to consider selling my position.

However this plays out, this week's news has raised a number of questions and resurfaced concerns about bank stocks. If this can happen to Standard Chartered -- a self-proclaimed "boring" bank that successfully navigated its way through the financial crisis and had avoided all the scandals that plagued other banks (LIBOR, mis-selling products, etc.) in recent years -- what global bank couldn't this happen to? And more importantly: Do modern banks deserve a place in a dividend portfolio?

Times have changed

Dividend investors have been understandably apprehensive about bank stocks following the financial crisis, as the events clearly put into perspective the reality that modern banks are not the 3-6-3 banks that used to anchor many dividend portfolios. Today's global banks, by contrast, have opaque balance sheets and are more exposed to fat-tail risks (rogue traders, money laundering, etc.) that can quickly impair results.

As a result, today's banks are very difficult to value and you're thus putting a lot of faith in management's ability to make the right decisions. This is exactly why recent events at JP Morgan (the London Whale) and this week's story about Standard Chartered are so disappointing. Both banks have been held up as models for global banking post-financial crisis and the reputations of both firms have been questioned, leaving investors with fewer straws to grasp. If you don't trust the bank's management, it's hard to feel confident about the bank's future.

Worth the trouble?

So why bother with banks when there are plenty of good dividend-paying shares in "less risky" sectors?

I think it's completely understandable for a dividend investor to walk away from bank stocks given events in the last five years, but it's important to keep the following things in mind before making that decision:

1.) If most investors are walking away from bank stocks, that could be an opportunity for contrarian investors to make money in the long-run.

2.) By managing your own portfolio, you get to determine how much exposure you want to certain companies and sectors. If you're cautious about banks but think there's opportunity, make them a small percentage of your portfolio so they can't do permanent damage if things go south.

3.) Sufficiently capitalized banks with good liquidity should be better able to deal with periodic shocks to their business without cutting the dividend.

4.) After the carnage of the financial crisis, banks have a vested interest in building dividend momentum as a sign of improving health.

I should note that this was part of my thesis for Standard Chartered, so time will tell if it holds water.

Look before you leap

StanChart will remain a small part of my portfolio for now, but I don't anticipate adding any other bank stocks to my dividend portfolio in the near-future. Some stocks are just simply not worth the trouble, even if they're potentially undervalued, and I think most global bank stocks fit that bill today. There are plenty of alternative investments out there with more transparent balance sheets, higher dividends, and better cash flows and are easier to value, as well.

Whatever you feel about big bank stocks, be sure to approach them with eyes wide open. Times have changed and today's banks aren't the banks of old -- their dividends are riskier and you should demand a meaningful margin of safety given the heightened uncertainty.