It now seems certain that dividend tax increases are on the way starting in 2013.
The point of this post is not to argue the wisdom (or lack thereof) of a dividend tax increase from a fiscal standpoint, so I won't add to that discussion here.
Instead, I want to explore how tax rate changes could affect corporate distribution policies, especially if dividend tax rates end up being higher than long-term capital gains tax rates.
Even things up
 |
| Source: LMCM.com |
Indeed, it stands to reason that another tax change in 2013 would similarly impact buyback and dividend policies.
Buybacks still surged
Despite the reforms that reduced the tax disadvantage of dividends, buyback activity has actually surged since the end of 2003 and has trumped dividend payouts 1.68-to-1 through 2011.
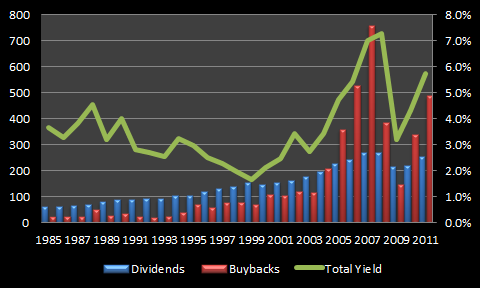 |
| Source: Birinyi Associates and FRB Z.1. |
That might change starting next year if no legislative effort is made to keep dividend and long-term capital gains taxes the same, as it would re-establish the tax disadvantage of dividends.
 |
| Source: Goldman Sachs |
Don't get me wrong -- I do not think that companies will stop paying dividends or stop increasing their payouts in a higher and unequal tax rate environment. Far from it.
It's entirely possible in such an environment, however, that relatively lower taxes on capital gains could add more fuel to buyback activity. If that's the case, dividend growth rates may be lower than what they might have been in an equal tax environment.
It's also possible that some younger companies that might have considered paying a small dividend in an equal tax environment may opt to focus on buybacks instead.
It will be interesting to see how it plays out, but unless Congress keeps tax rates on dividends and long-term capital gains the same (even if they are both increased) I expect to see buybacks continue to account for the bulk of total distributions.
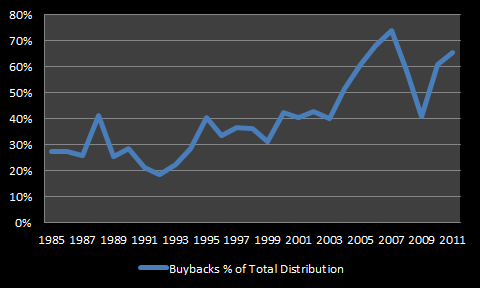 |
| Source: Birinyi Associates and FRB Z.1. |
Thanks for reading!
Best,
Todd
@toddwenning on Twitter